Bullwhip Effect: Why Order Swings Knock Your Shipping Off Track

Oct 22, 2026
13 min.
In brief
The Bullwhip Effect in Supply Chain: What B2B Companies Need to Know
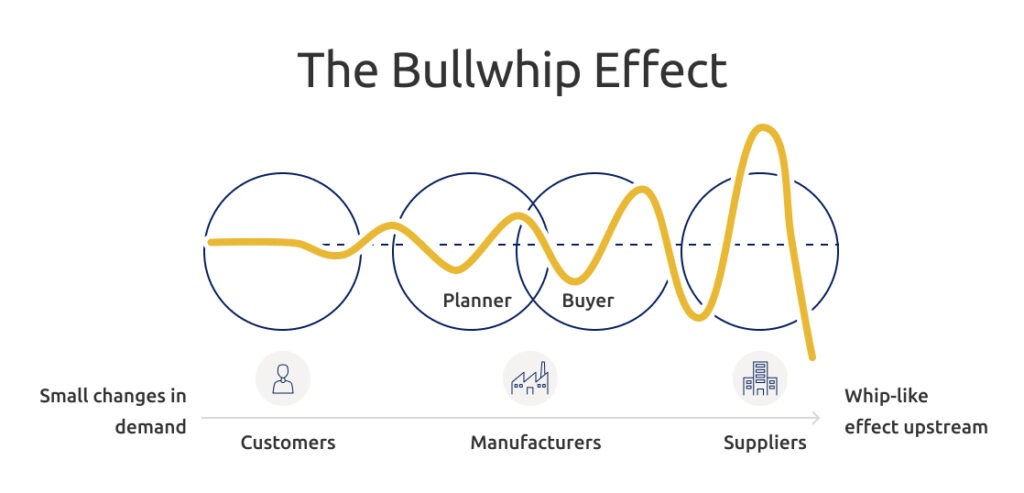
A retailer sells a little more than usual in one week. The wholesaler sees a noticeably bigger order and thinks: something is going on. The manufacturer hears about it, runs the numbers and plans for an even higher figure. At the far end of the chain, the raw material supplier receives an order that bears little relation to actual consumption. Nobody has miscalculated. Yet the entire chain is out of step. Welcome to the bullwhip effect.
The bullwhip effect is one of the most cited problems in supply chain management, and it is expensive. It ties up capital in stock nobody needs and leaves other stock missing when it matters. For B2B companies, it shows up first in shipping: in order volumes, pickup schedules and sudden peaks in dispatch. Anyone who only watches incoming orders often reacts too late or too hard.
This article explains what the bullwhip effect is, what causes it and what effects it has on inventory and logistics. It shows how to measure it and which levers help, and it covers where shipping fits in. Let’s be upfront: LetMeShip does not plan your inventory. A shipping platform can, however, bring transparency to shipments and transit times, and that data makes proper planning possible.
What Is the Bullwhip Effect? Definition and Origin
The bullwhip effect is the amplification of demand variability as orders move upstream through a supply chain. Orders placed with suppliers vary far more than sales to buyers, even though end demand is comparatively steady. The name comes from the whip: a small flick of the handle becomes a sharp crack at the tip of the lash. The further a stage sits from the end customer, the more violently its orders swing.
The idea grew out of research on industrial dynamics. Jay Forrester, the MIT professor, described the underlying dynamics in 1961 in his book Industrial Dynamics, which is why the effect is sometimes called the Forrester effect. It became widely known in 1997 through Hau L. Lee, V. Padmanabhan and Seungjin Whang, who described it in the Sloan Management Review under the title “The Bullwhip Effect in Supply Chains”. Their work remains the starting point for most analyses. Other names you will come across are the whiplash effect and, in German, the Peitscheneffekt.
The crucial point: nobody has to be careless. The effect arises from sensible individual decisions that reinforce one another. For more shipping terms, see our dispatch dictionary.
Bullwhip Effect in Supply Chain: Four Causes
1. Forecasts based on orders rather than actual demand. Each stage forecasts from its customer’s orders. A single spike is then read as a trend and passed on. The error grows with every stage.
2. Order batching. Fixed cycles and minimum quantities make orders arrive in waves. The supplier sees nothing for a week, then a mountain.
Order batching and its contribution to supply chain volatility
Batching is often rational on its own. Full truckloads, volume discounts and fixed review cycles all make one large order look sensible. Added up across a chain, the result is a series of spikes that no single stage intended. Shorter, more frequent orders are the most direct counter, provided the cost per order does not rise too far.
3. Discounts and promotions. Deals act like a starting gun for forward buying. Customers buy when it is cheap, and demand before and after the promotion looks heavily distorted.
4. Rationing and shortage gaming. When goods are scarce, everyone orders more than they need, just to be safe. The supplier rations, and the signals become even less reliable. Anyone who has lived through a crisis knows exactly what this looks like.
Long lead times and missing information between partners add to all four causes, because every delay forces a bigger reaction.
Effects of the Bullwhip Effect on Inventory and Logistics
The effects of the bullwhip effect are concrete and expensive. Warehouses are simultaneously overflowing and empty. Production and dispatch capacity swings between idle and overloaded. Expedited orders, overtime and special freight charges follow. Some of the damage is less visible: customers lose trust when delivery dates slip, and supplier relationships suffer when orders are cut or doubled without warning.
- Excess stock: capital is tied up in inventory that may age or spoil.
- Shortages: when real demand finally arrives, the buffers may already be gone.
- Unstable capacity: staff, storage and transport are booked for peaks that never come back.
- Higher costs: storage, handling and expedited freight all rise.
- Strained partnerships: suppliers and customers stop trusting the signals they receive.
How a Small Blip Becomes a Big Problem: A Worked Example
The example below is fictional. The numbers are invented; the pattern is real. The end customer buys 20 per cent more than usual in one week. Each stage responds sensibly and adds its own cushion:
| Stage | Normal week (order quantity) | Week with +20 % end demand | Change |
|---|---|---|---|
| Endkunde/Abverkauf | 100 | 120 | +20 % |
| Händler | 100 | 140 | +40 % |
| Großhandel | 100 | 170 | +70 % |
| Hersteller | 100 | 220 | +120% |
The end customer bought 20 per cent more; the manufacturer plans for 120 per cent more. Everyone has a good reason to act as they do, and yet the result is wrong.
Measuring the Bullwhip Effect: Key Metrics for Supply Chain Managers
Maths need not hurt. The key metric is the ratio of the variance of orders to the variance of end demand. Above 1, orders swing more than demand does. Track it per stage, and compare the results over time rather than in a single week.
For a moving-average forecast, as used in many planning systems, Chen, Drezner, Ryan and Simchi-Levi (2000) derived a lower bound:
Var(orders) / Var(demand) ≥ 1 + 2L/p + 2L²/p²
L is the replenishment lead time in periods, p the number of periods in the forecast window. With a two-week lead time and a four-week window, the ratio is at least 2.5: orders swing at least 2.5 times as much as demand. It is easy to see what a long replenishment lead time can do.
The formula holds under the model’s assumptions. Treat it as a compass, not a measuring instrument.
You can do without the formula. Three checks give a first diagnosis:
- Record weekly quantities: sales to end customers, orders placed with suppliers and orders received from customers, kept separate.
- Compare the swings: calculate the variance or standard deviation for each stage and set it against end demand.
- Look for anomalies: moments when orders spike more than sales. They often coincide with promotions, order cycles or shortages.
Bullwhip Effect vs. Safety Stock: What B2B Managers Need to Know
Safety stock protects against uncertainty, so it is part of the answer and part of the problem. Sized from measured demand variation and lead time, it absorbs shocks. Set as a blanket percentage, or raised by each stage in turn, it adds to the swing: every stage increases its order to protect its own cushion, and the signal is distorted again.
The working rule is simple. Size safety stock from measured variation and lead time, and review it whenever either changes. Do not add a fixed uplift at every stage.
Countering the Bullwhip Effect: Inventory and Information Strategies
The causes are known, and so are the remedies. The awkward news: the simplest steps are often the most effective.
- Share sales data. Whoever passes on end-customer demand and stock movements has to guess less. This is often the step with the biggest effect for the smallest budget.
- Cut order batching. Smaller, more frequent orders smooth the signal. Ask yourself honestly whether the fixed order cycle still matches demand, or has become a habit.
- Make prices predictable. Announce promotions in advance and limit forward buying. Stable prices remove part of the incentive to batch orders.
- Shorten and stabilise lead times. Shorter and more reliable replenishment lead times need less buffer. In the formula above, this is precisely the lever L.
- Use forecasting software. Planning systems and AI-supported forecasts help separate genuine trends from outliers. They do not replace clean data: a good model fed with poor data still gives a poor result, just better presented.
- Set safety stock with care. Blanket buffers at every stage make the problem worse, as described above.
- Communicate shortages openly. Whoever allocates transparently when stock is short prevents customers from ordering twice as much out of caution.
The role of information sharing in reducing order fluctuations
Information sharing is often the lever with the largest effect. When suppliers see point-of-sale data rather than order history, they plan against real demand. Sharing forecasts, promotion calendars and stock levels achieves much the same, as long as the data is current and everyone uses the same figures.
How Shipment Transparency Supports Supply Chain Stability
Real-time data on the status of a shipment is part of the solution. Anyone who can see at any time where a shipment is and when it will arrive plans with real figures rather than guesswork. If shipment volumes suddenly rise, transit times slip or delays pile up on a lane, these are signals that belong in inventory planning, not in the post-mortem. To track your international shipments, see our page on shipment tracking.
Flexibility in shipping is not a comfort feature but a strategic necessity. If you have only one carrier available in a peak week, you either pay a surcharge or ship late. Anyone who can compare several providers on one platform and book straight away has options exactly when the plan goes off track. That is the concrete contribution LetMeShip can make to a volatile supply chain.
Being honest: a shipping platform is not a planning system. It provides shipment data and creates room for manoeuvre. The rules your supply chain needs, you set yourself.
How Carrier Selection Affects Supply Chain Stability
Shipping affects stability more than you might think. What matters is less the price than the reliability of transit times. If transport times vary a lot, every stage plans with extra buffer, and that is when the whip gets longer. A provider with predictable transit times makes the replenishment lead time L easier to calculate.
Whether you ship from Germany, Austria, Switzerland, France or Spain, the principle is the same: the more predictable your transit times, the less buffer your chain needs.
This article does not compare rates. It is about stability.
- Check transit times: For your main lanes, compare not only the duration but also how much it varies.
- Reduce dependency: If you rely on a single shipping provider, you have no alternative when it runs into trouble. Several providers side by side create options. Keyword: multi-carrier shipping. You can compare available providers and rates directly on the LetMeShip platform.
- Choose the right provider: Which providers suit your destination, weight and service needs is set out on our shipping service providers page, which covers FedEx, DHL Express and UPS, among others.
For the question of standard versus express, read our page on express delivery.
Real-World Examples of the Bullwhip Effect in B2B Logistics
The pattern shows up wherever several stages order from one another. A case often cited in the original research comes from consumer goods: orders for diapers at the manufacturer swung far more than purchases at the shop. Lee and colleagues use it to show how small changes at the till become large changes upstream.
Fast-fashion retailers are another frequently cited case. Short, frequent replenishment limits how far demand swings can travel upstream, which is the counter-principle to the causes above.
For B2B shippers, the effect is often visible in dispatch. Consider a spare-parts dealer for mechanical engineering that ships around 40 parcels a week to its workshop customers. Then a major customer’s monthly bulk order arrives, over around 300 parcels, and mid-year a promotion starts that doubles demand for two weeks. The dispatch team goes through three waves in a row: the bulk order at the start of the month, the promotion, and then a lull, because the major customer has built up stock.
This dealer example is fictional and for illustration only. Anyone who looks only at incoming orders schedules staff and collections around these waves and, two weeks later, has capacity nobody needs. On our platform, that dispatch team could have switched to a second carrier during the peak week.
Conclusion: A Small Swing Need Not Become a Big One
The bullwhip effect is not a force of nature. It results from planning rules and information gaps, and both can change. Share sales data, review your order cycles and keep an eye on transit times on your main lanes. The whip will then crack a good deal less hard.
Your shipping lanes are part of this chain. With transparent shipment data and several providers, you have options when the plan does go off track.
Ready for your next shipment? Compare rates and book now
Also worth reading: Strengthening the resilience of supply chains · Are you familiar with the Milkrun Concept · Secure supply chains: shipping and logistics costs as a key success factor · International shipping with LetMeShip
FAQ
Frequently Asked Questions About the Bullwhip Effect
What does bullwhip mean?
The term comes from the bullwhip, the long whip whose tip snaps much harder than the handle moves. The effect is also known as the whiplash effect. In supply chains, it describes how order swings grow as they travel upstream.
What is the bullwhip effect in supply chain management?
It is the amplification of demand variability along a supply chain. Orders placed with suppliers swing more strongly than end-customer demand, and the further a stage sits from the end customer, the bigger the swings. Nothing has to go wrong for it to happen.
What is another name for the bullwhip effect?
The whiplash effect and the Forrester effect are two other names for the same phenomenon. In German, it is called the Peitscheneffekt.
What is a real-life example of the bullwhip effect?
A spare-parts dealer experiences three waves of orders in a row: a major customer orders in bulk every month, and a promotion distorts demand further. Dispatch then plans capacity for peaks that will not come back two weeks later. The section “Real-World Examples” describes this in more detail.
What causes the bullwhip effect?
Forecasts based on orders rather than end-customer demand, order batching, price fluctuations from promotions and rationing in shortage periods. Long lead times and missing information between partners reinforce these causes.
How does order batching contribute to supply chain volatility?
Each batch arrives as a spike, and the chain amplifies that spike upstream. Batching is often rational for the individual buyer, which is why it persists. Smaller and more frequent orders reduce the size of each spike.
How can B2B companies counteract the bullwhip effect?
Share sales data, place smaller and more regular orders, plan promotions in advance, shorten and stabilise lead times, and size safety stock on the actual variation rather than as a blanket buffer.
How does the choice of carrier affect supply chain stability?
Transit time is part of the replenishment lead time. If it varies a lot, the chain needs more buffer and the effect grows. Predictable transit times, and the option to switch to another provider when disruptions hit, stabilise planning.
What role do real-time data play in dampening the bullwhip effect?
Real-time data on shipments and stock movements replace guesswork with actual figures. Anyone who knows the status of deliveries and requirements has to infer less from orders. That dampens the amplification but does not replace sound planning rules.

Hi, I’m Eike 👋
I’m in the LetMeShip Sales team and ready to get the best rates and shipping options for you.
Let’s talk – We’re Here to Help!
Get a call back or book an appointment at your convenience.